
Linux has emerged as the go-to operating system for server management and network administration, thanks to its robust performance and open-source nature. To ensure that your Linux-based systems run seamlessly, it’s crucial to have effective network and performance monitoring tools in place. In this article, we’ll explore some of the top Linux network monitoring tools, including Zabbix, Nagios, Netdata, Glances, Monit, Sysstat, Icinga, Observium, Web VMStat, Linux Dash, Wireshark, and Webmin. We’ll dive into the key features, advantages, and potential drawbacks of each tool to help you make an informed choice.
What are Linux Network Monitoring Tools?
Linux network monitoring tools are essential for system administrators and IT professionals to efficiently manage and monitor network performance, troubleshoot issues, and ensure optimal server performance. These tools provide valuable insights into network traffic, system health, and resource utilization, enabling proactive maintenance and swift problem resolution.
In this article, we’ll delve into some of the top performance and network monitoring tools for Linux, highlighting their key features, pros, and cons to help you choose the right tool for your monitoring needs.
1. Zabbix
Zabbix, created by Alexei Vladishev, is actively developed and supported by Zabbix SIA.
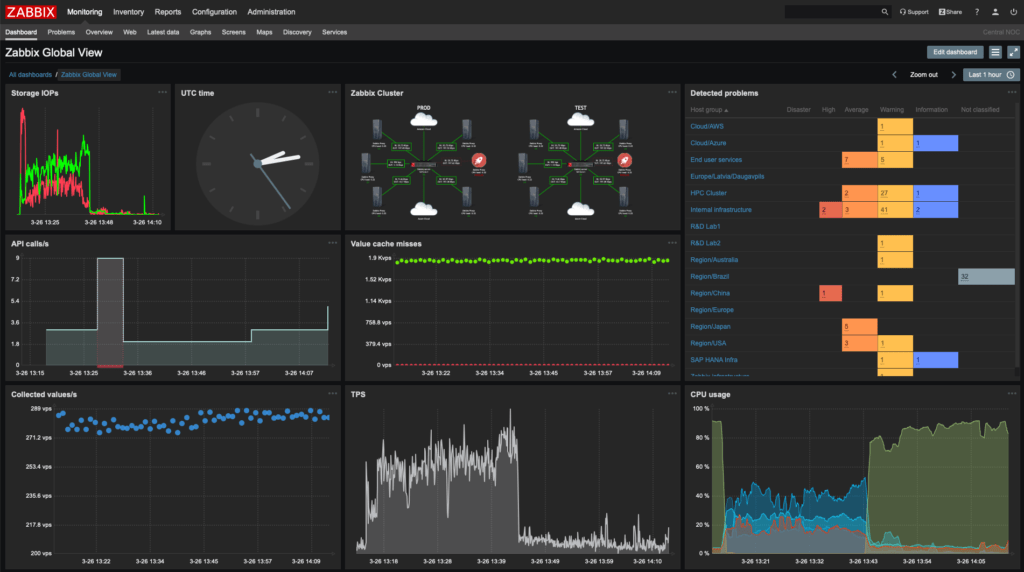
Zabbix, an enterprise-class open source distributed monitoring solution, monitors various network parameters and the well-being of servers, virtual machines, applications, services, databases, websites, the cloud, and more. Zabbix employs a versatile notification system, allowing users to configure email alerts for nearly any event, facilitating quick response to server issues. Zabbix provides robust reporting and data visualization capabilities based on stored data, making it an excellent choice for capacity planning.
Zabbix offers support for both polling and trapping. All reports, statistics, and configuration settings in Zabbix are accessible via a web-based interface, ensuring network status and server health can be checked from any location. When properly configured, Zabbix can play a vital role in monitoring IT infrastructure, whether for small organizations with a few servers or large companies with numerous servers.
Zabbix is free and distributed under the GPL
Key Features:
- Comprehensive monitoring of servers, networks, and applications.
- Real-time monitoring and alerting.
- Web-based interface for easy configuration and management.
- Support for multiple data collection methods.
- Extensive reporting and visualization capabilities.
Pros:
- Highly customizable and flexible.
- Scalable to accommodate large and complex infrastructures.
- Supports agentless and agent-based monitoring.
- Community-contributed templates for common services and devices.
Cons:
- Initial setup and configuration may be complex for beginners.
2. Nagios
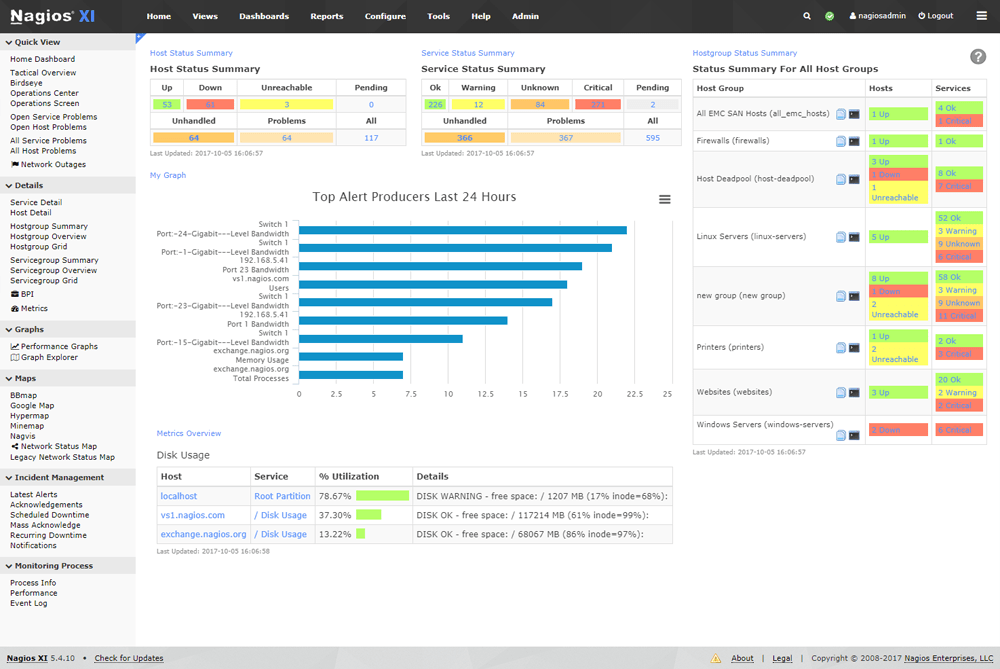
Nagios serves as an open source IT system monitoring tool designed for Linux, capable of overseeing devices using Linux, Windows, and Unix operating systems.
Nagios software regularly inspects essential application, network, and server resource parameters. For instance, Nagios monitors memory usage, disk utilization, and processor load, alongside active processes, and log files. Additionally, Nagios oversees services like Simple Mail Transfer Protocol (SMTP), Post Office Protocol 3, Hypertext Transfer Protocol (HTTP), and other common network protocols. Active checks are initiated by Nagios, while passive checks are generated by external applications linked to the monitoring tool.
Originally introduced as NetSaint in 1999, Nagios was created by Ethan Galstad and further refined by numerous contributors in the realm of open source projects. Nagios Enterprises, a company centered on Nagios Core technology, offers a range of products, including Nagios XI, Log Server, Network Analyzer, and Fusion.
Key Features:
- Flexible monitoring through plugins and addons.
- Monitoring of hosts, services, and network devices.
- Notification system for timely alerts.
- Ability to schedule and automate monitoring tasks.
- Detailed reporting and trend analysis.
Pros:
- Established and widely used in the industry.
- Extensive community support and vast plugin ecosystem.
- Highly configurable to suit various monitoring needs.
Cons:
- Configuration can be intricate, especially for large-scale deployments.
3. Netdata
Netdata is a real-time performance monitoring tool that provides detailed insights into system health, applications, and network performance. It offers a web-based dashboard for real-time monitoring, making it ideal for quick analysis and troubleshooting.
Key Features:
- Real-time monitoring and visualization of system performance.
- Lightweight and efficient for resource utilization.
- Detailed insights into CPU, memory, disk, and network usage.
- Web-based dashboard for easy access and customization.
Pros:
- Quick and easy installation.
- Highly responsive and user-friendly interface.
- Supports various plugins for extended functionality.
Cons:
- Focused more on real-time monitoring, may lack some historical data features.
4. Glances
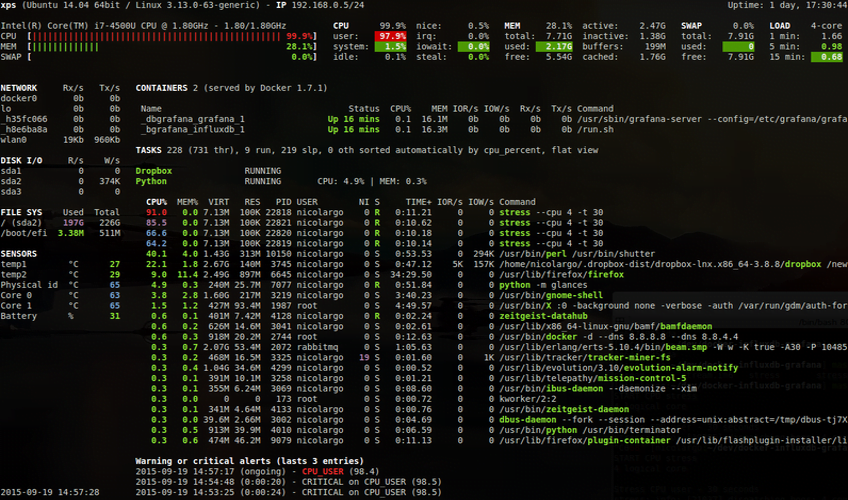
Glances is a lightweight and cross-platform monitoring tool that provides real-time system information in a visually appealing manner. It offers a variety of monitoring options, including CPU, memory, disk usage, network stats, and more, all in a single screen.
Key Features:
- Compact and lightweight system monitoring tool.
- Real-time monitoring of CPU, memory, disk, and network.
- Command-line and web interface options for monitoring.
Pros:
- Easy to install and use.
- Requires minimal system resources.
- Ideal for quick system checks and monitoring on the go.
Cons:
- Limited historical data and reporting capabilities.
5. Monit
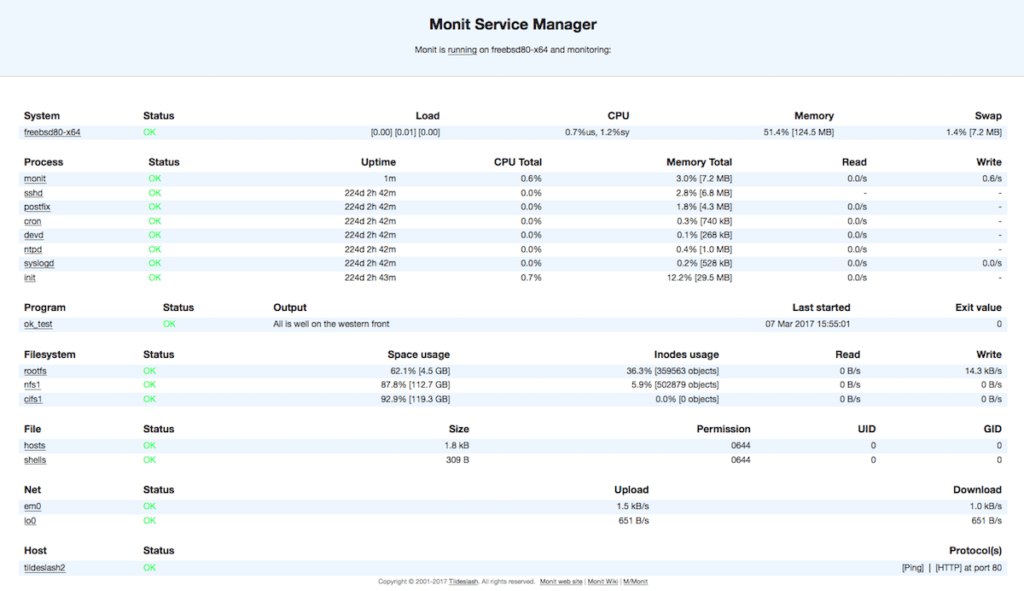
Monit is an open-source utility for managing and monitoring Unix systems. It can monitor processes, files, directories, and devices. Monit provides automatic maintenance and repair actions based on defined conditions, ensuring system stability and reliability.
Key Features:
- Automated monitoring and maintenance of Unix systems.
- Monitoring of processes, files, directories, and filesystems.
- Alerts and actions based on predefined conditions.
- Web interface for configuration and status monitoring.
Pros:
- Lightweight and efficient.
- Easy-to-understand configuration syntax.
- Versatile in managing and monitoring various aspects of the system.
Cons:
- Advanced configurations might require detailed knowledge of the system.
6. Sysstat
Sysstat is a powerful system performance monitoring tool that collects and reports performance data for Linux systems. It includes utilities like sar, iostat, mpstat, and pidstat, which provide valuable insights into system activity, CPU usage, disk I/O, and more.
Key Features:
- Collects system performance data at regular intervals.
- Monitors CPU, memory, disk, network, and process activity.
- Stores historical performance data for analysis and reporting.
Pros:
- Low overhead on system resources.
- Data retention for in-depth analysis and troubleshooting.
- Simple command-line interface for ease of use.
Cons:
- Lacks a built-in web-based graphical interface.
7. Icinga
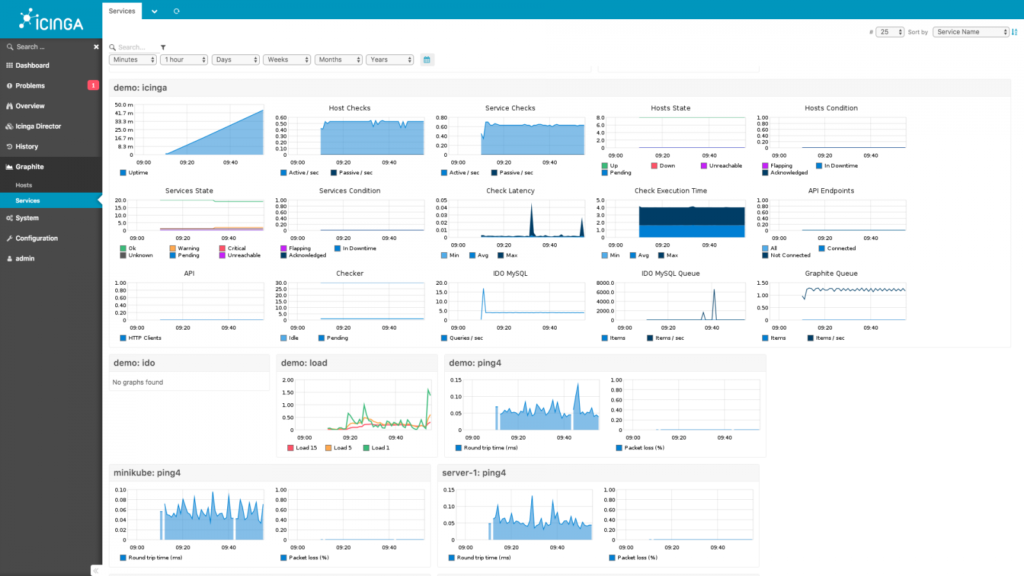
Icinga is an open-source monitoring tool that evolved from Nagios. It offers a scalable and extensible monitoring system, providing advanced features for monitoring hosts, services, and network devices. Icinga supports various plugins and has a user-friendly interface.
Key Features:
- Powerful monitoring and alerting for hosts and services.
- Support for various notification methods, including email and SMS.
- Scalable and extensible through plugins and addons.
- Web interface for configuration and monitoring.
Pros:
- Flexible and easy to configure.
- Active development and community support.
- Compatible with Nagios plugins for added functionality.
Cons:
- Learning curve for newcomers to the monitoring domain.
8. Observium
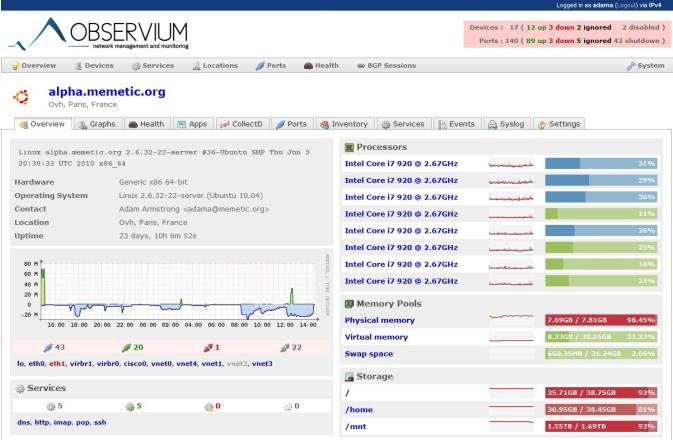
Observium is a network monitoring and management platform designed to support a wide range of devices and systems. It provides detailed graphs and reports on network performance, making it valuable for monitoring and managing large-scale networks.
Key Features:
- Network monitoring focused on device performance and health.
- Automatic discovery and mapping of network devices.
- Real-time status monitoring and alerting.
- Extensive support for various network hardware.
Pros:
- Designed for network-centric monitoring.
- Clean and intuitive interface.
- Suitable for managing complex network infrastructures.
Cons:
- Some advanced features are available only in the paid version.
9. Web VMStat
Web VMStat is a web-based graphical user interface for the Linux vmstat command. It provides a visual representation of various system metrics, helping users easily monitor memory, CPU, and other critical system parameters.
Key Features:
- Web-based interface for monitoring system performance.
- Real-time display of CPU, memory, disk, and network activity.
- Historical data for performance analysis.
Pros:
- Quick and easy access to system statistics.
- Lightweight and does not require installation.
Cons:
- Limited features compared to more comprehensive monitoring tools.
10. Linux Dash
Linux Dash is a simple and lightweight dashboard for monitoring Linux servers in real-time. It offers an intuitive web interface to view CPU, memory, disk usage, and other important metrics at a glance.
Key Features:
- Lightweight and fast system monitoring dashboard.
- Real-time monitoring of system resources.
- Responsive design suitable for various devices.
Pros:
- Quick setup and minimal configuration.
- Intuitive interface for easy monitoring.
- No external dependencies for basic monitoring.
Cons:
- Limited in features compared to more robust monitoring solutions.
11. Wireshark
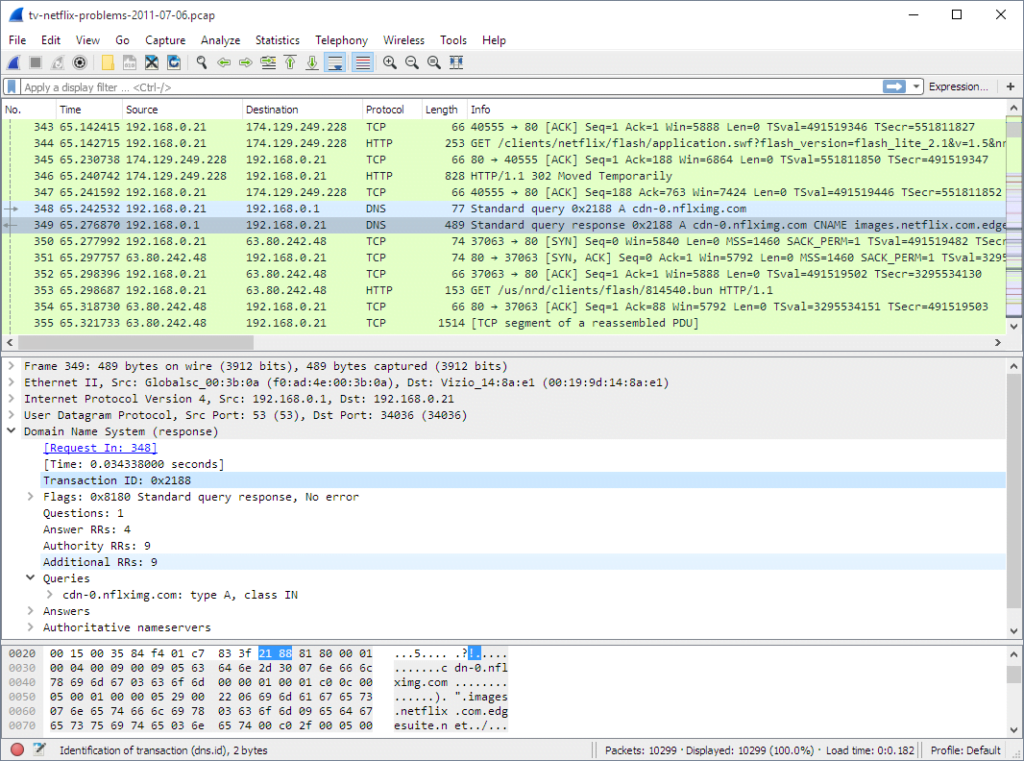
Wireshark is a widely-used network protocol analyzer that allows for deep inspection of network traffic. It is an essential tool for network troubleshooting, analysis, and security assessment on Linux and other platforms.
Key Features:
- Network protocol analyzer for in-depth packet analysis.
- Supports a wide range of protocols for monitoring network traffic.
- Advanced filtering and decoding capabilities.
Pros:
- Powerful tool for network troubleshooting and analysis.
- Community-contributed plugins and extensions.
- Cross-platform support.
Cons:
- Steeper learning curve due to its extensive feature set.
12. Webmin
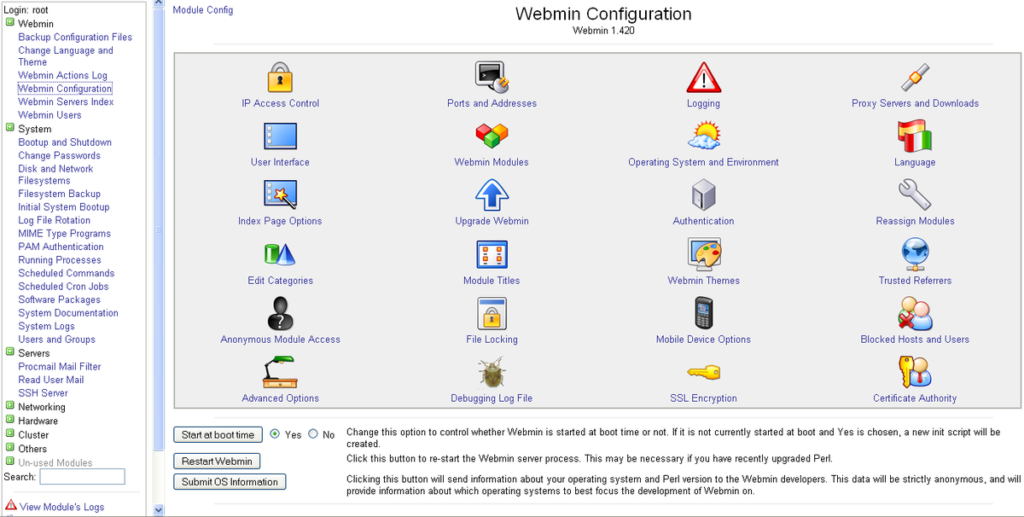
Webmin is a web-based system administration tool that provides a user-friendly interface for managing Linux systems. It allows users to configure system settings, manage users, monitor performance, and more, all through a web browser.
Key Features:
- Web-based system administration interface.
- Management of various system settings and services.
- User-friendly interface for configuration and monitoring.
Pros:
- Simplifies system administration tasks.
- Extensive documentation and community support.
- Suitable for both beginners and experienced administrators.
Cons:
- May not provide as granular monitoring as specialized monitoring tools.
Conclusion
Choosing the right Linux network monitoring tool depends on your specific monitoring needs, infrastructure size, and complexity. Each tool has its strengths and weaknesses, and evaluating them based on your requirements is crucial to achieving effective performance and network monitoring for your Linux systems. Whether you need real-time monitoring, historical data analysis, or in-depth packet analysis, the Linux network monitoring tools mentioned in this article provide a solid foundation for maintaining a well-monitored and efficient IT environment.