In this article, I will talk about how you can install Prometheus Stack on Kubernetes. With Grafana, we will be able to monitor our entire Kubernetes Cluster in detail. You can monitor all the metrics you can think of and you will be able to send alerts to certain platforms in certain situations with the rules you will enter.
What is Prometheus?
It is a metrics infrastructure / server. It is very popular right now. It is a CNCF (Cloud Native Computing Foundation) project. Its biggest feature is pullbase operation. It allows you to collect metrics in a central place. It has become the standard metrics collection tool of Kubernetes.
Why Monitoring or Prometheus
The operating system, applications (mongodb, redis, java, etc.) and developed applications use various resources such as processor, hard disk, ram, network to fulfill their expected functions. If there are problems or insufficient resources, the operation of the systems may be disrupted. Monitoring-monitoring or monitoring applications check the resources at regular intervals and keep track of the resources required for the smooth operation of the systems. Prometheus is one of the tools that do this.
Using the alerting system or alerting in Prometheus, it allows sending alerts according to the capacity and status of the resources. Push-push and pull-pull methods are used as monitoring methods. Unlike other systems, Prometheus uses the pull-pull method by default. In the push-push method, the sources to be monitored fulfill the responsibility of sending the monitoring data (push-push-send) as well as the function expected from them. In the pull-pull method, the sources make the trace data available via an address and allow the application (prometheus, etc.) to receive the data. Thanks to the pushgateway in Prometheus, it also provides push-push based monitoring.
The features that distinguish Prometheus from other tools are that it is push-pull based, has a simple structure, is frequently used in cloud-based applications and is supported by Cloud Native.
What is Grafana?
It is a tool that enables visualization of collected metrics. Grafana is also a CNCF (Cloud Native Computing Foundation) project. Grafana is compatible not only with Prometheus but also with many other tools.
URL: https://grafana.com
How to Install Prometheus Stack?
It can be installed quickly with the helm command over the Kubernetes master server. It does not need manual configurations.
What is Prometheus Stack?
It is a bundled package on the Helm package provider that enables tools such as Node Exporter, Kubernetes Metrics, Application Metrics, Grafana, Alerting to be installed in bulk.
URL: https://github.com/prometheus-community/helm-charts/tree/main/charts/kube-prometheus-stack
Requirements
- Kubernetes Cluster
- Helm Package Manager (Helm Installation)
Prometheus Stack Architecture

Installation Phase
First of all, we create a namespace on kubernetes called “monitoring”.
kubectl create namespace monitoringWe add the Prometheus-comunity repo to helm.
helm repo add prometheus-community https://prometheus-community.github.io/helm-chartsWe update our Helm repos.
helm repo updateThen we install Prometheus Stack with helm on the namespace we created.
helm install prometheus-stack prometheus-community/kube-prometheus-stack --namespace monitoringLet’s check the created pods.
kubectl get pods -n monitoringNAME READY STATUS RESTARTS AGE
alertmanager-prometheus-stack-kube-prom-alertmanager-0 2/2 Running 0 6m54s
prometheus-prometheus-stack-kube-prom-prometheus-0 2/2 Running 0 6m54s
prometheus-stack-grafana-84f9b65c9f-pnkst 3/3 Running 0 7m19s
prometheus-stack-kube-prom-operator-7d8bdcd78b-j6tzn 1/1 Running 0 7m19s
prometheus-stack-kube-state-metrics-6b94c49df6-tw9xf 1/1 Running 0 7m19s
prometheus-stack-prometheus-node-exporter-q8b7h 1/1 Running 0 7m19sNginx Ingress (Optional)
If you have ingress controller installed in your kubernetes cluster, you can access grafana with ingress below.
You can replace devopstips.local with your own domain address.
apiVersion: networking.k8s.io/v1
kind: Ingress
metadata:
  generation: 1
  name: grafana
  namespace: monitoring
spec:
  ingressClassName: nginx
  rules:
  - host: devopstips.local
    http:
      paths:
      - backend:
          service:
            name: prometheus-stack-grafana
            port:
              number: 80
        path: /
        pathType: Prefix
Changing the Default Password
When we connect to our Grafana address via browser, the Login page will greet us.

We can find out our username and password with the following command.
By default the user information is as follows. Be sure to change it!
Username: admin
Password: prom-operator
Click on the user profile picture in the left menu and then click > “Change Password”.
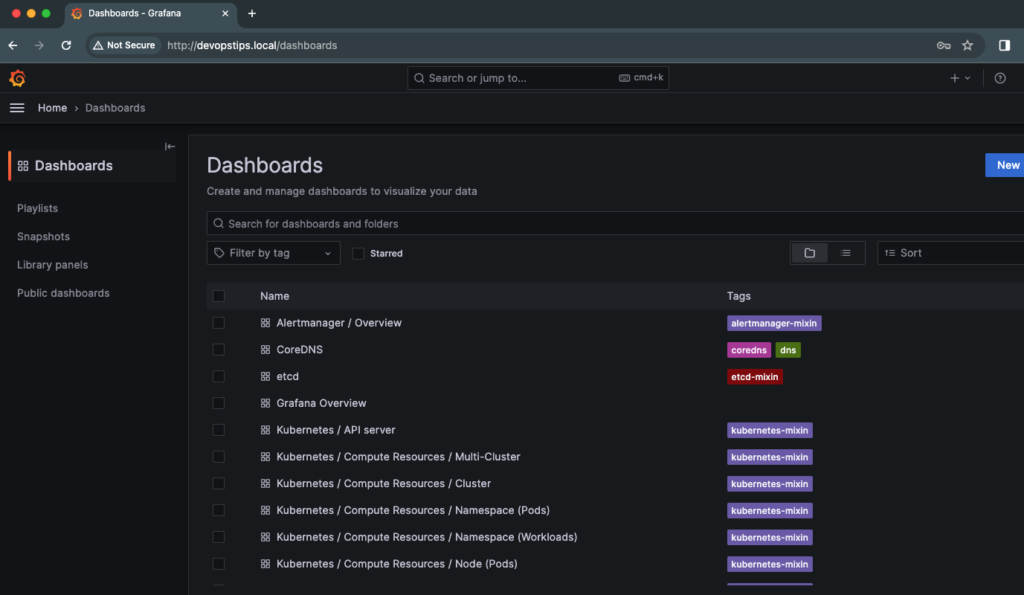
Grafana Dashboards
By default, Prometheus Stack comes with many dashboards ready to use.
Find out about the Kubernetes Monitoring Tools: https://devopstipstricks.com/8-free-kubernetes-monitoring-tools-that-you-need-to-know/
References:
https://prometheus.io/
https://github.com/prometheus-community/helm-charts/tree/main/charts/kube-prometheus-stack
https://grafana.com/